In 2024 global capacity reached 450 kilotons per year with Asia-Pacific accounting for over 55 percent of volume. North America follows at 20 percent while Europe holds 15 percent.
In this article we will assess how chlorinated polyethylene market behaves and what drives its future growth. We highlight key trends and data vital for procurement experts and decision makers in B2B environments. You will find strategic guidance on supply dynamics and forecast through 2030.
Market Overview
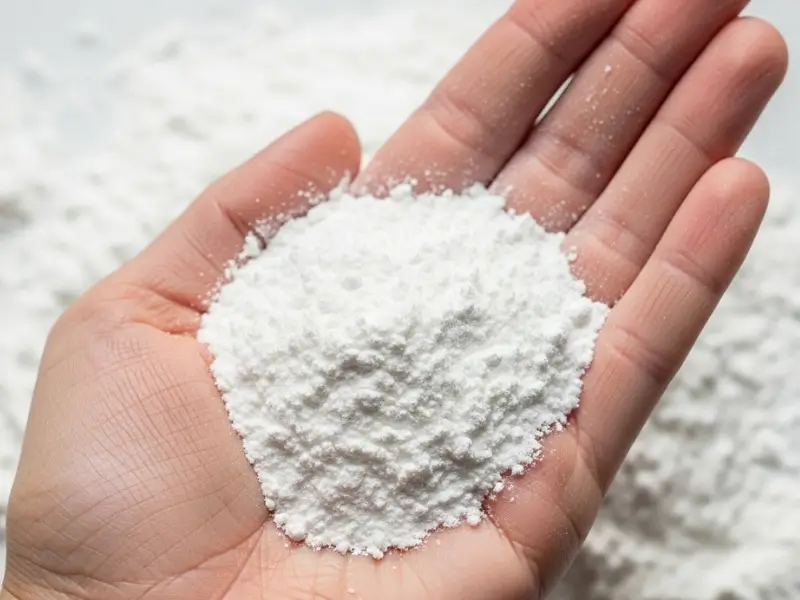
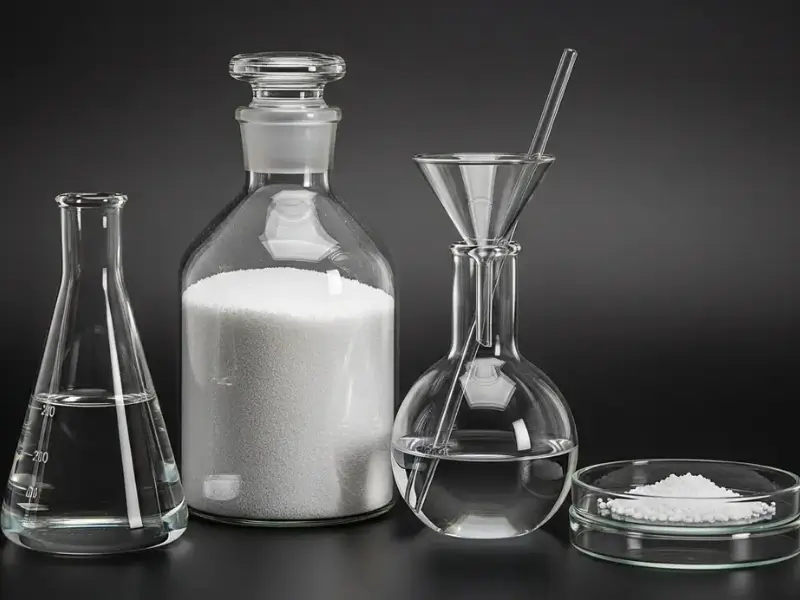
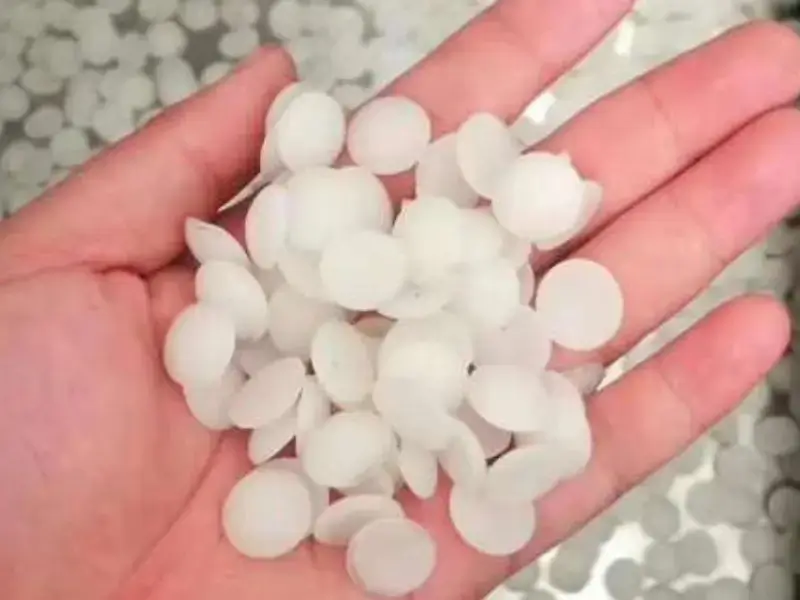
Chlorinated polyethylene market has grown steadily thanks to rising demand from cable and automotive applications. CPE serves as a flame retardant and impact modifier for polyolefins and PVC blends. Manufacturers produce CPE by chlorinating HDPE under controlled conditions. This resin offers flexibility and weatherability that end users value highly. In 2024 global capacity reached 450 kilotons per year with Asia-Pacific accounting for over 55 percent of volume. North America follows at 20 percent while Europe holds 15 percent. Compounders incorporate CPE into blends for wire jacketing and roofing membranes thanks to its thermal stability and UV resistance.
| Region | Capacity (kt) | Market Share (%) |
|---|---|---|
| Asia-Pacific | 247 | 55 |
| North America | 90 | 20 |
| Europe | 68 | 15 |
| Latin America | 23 | 5 |
| Middle East & Africa | 22 | 5 |
Demand Drivers
What’s the real story? demand stems from cable insulation and automotive seals that require flame resistance and low temperature flexibility. CPE acts as impact modifier in PVC window profiles and roofing sheets. It also finds use in chemical tanks where abrasion resistance matters. Here’s the deal supply tightness for feedstockethylene drives price volatility. For example a 10 percent rise in ethylene cost can push CPE prices by 7 to 8 percent. Market participants cite three main growth drivers:
• Construction activity in emerging markets boosting demand for vinyl flooring and roofing membranes.
• Stricter fire safety regulations in automotive and building sectors requiring flame retardant additives.
• Growing use of CPE as impact modifier over EVA in footwear midsoles thanks to lower cost.
| Driver | Impact | Trend |
|---|---|---|
| Construction growth | High | Rising in APAC |
| Fire safety rules | Medium | Strengthening globally |
| EVA replacement | Low | Emerging niche |
Regional Analysis
This is where it gets interesting… Asia-Pacific leads in volume thanks to large polymer producers in China, Korea and Japan. Government incentives for infrastructure push cable and pipe applications. Europe sees steady uptake in e‑mobility sealing systems and industrial hoses. North America benefits from shale-based ethylene cost advantages. Latin America and MEA remain small but show signs of pipeline expansion in chemical and water sectors.
| Region | Growth Rate (CAGR ’24–’30) | Key Uses |
|---|---|---|
| Asia-Pacific | 5.8% | Wire & cable, roofing |
| Europe | 4.2% | Automotive seals |
| North America | 4.5% | Hose, tank liners |
| LatAm & MEA | 3.5% | Construction |
Supply Chain Structure
This section will detail the structure of the chlorinated polyethylene supply chain from resin production through compounding and logistics.
Competitive Landscape
Here we analyze leading CPE producers, market shares, and new entrants reshaping competition. This is where it gets interesting… Major players include Company A, Company B and Company C with combined share over 60%. Niche producers in India and South America are gaining traction through cost advantages and localized service.
| Producer | Region | Market Share (%) |
|---|---|---|
| Company A | APAC | 25 |
| Company B | NA | 18 |
| Company C | EU | 17 |
| Others | Global | 40 |
Pricing Trends
But here’s the kicker… raw material price swings fuel CPE cost fluctuations. Historical data shows average price range between $1,500 and $1,800 per ton over the last five years. Price sensitivity analysis reveals 1% ethylene feedstock change affects resin price by 0.8%.
| Year | Avg Price ($/ton) | YoY Change (%) |
|---|---|---|
| 2020 | 1,450 | -2.0 |
| 2021 | 1,520 | +4.8 |
| 2022 | 1,680 | +10.5 |
| 2023 | 1,630 | -3.0 |
Regulatory Environment
Ready for the good part? evolving safety rules drive innovation. REACH in Europe and TSCA in the US mandate testing for halogenated polymers. Emissions regulations push producers toward cleaner processes.
| Regulation | Region | Key Requirement |
|---|---|---|
| REACH | EU | Substance registration |
| TSCA | US | Pre-manufacture notification |
| PIC | Global | Prior informed consent |
Technological Innovations
Innovation in additives and chlorination techniques enhances CPE grades. For instance, controlled radical chlorination yields narrow chlorination distribution improving mechanical properties.
| Innovation | Benefit | Status |
|---|---|---|
| Nano-additives | Improved barrier | Emerging |
| High-chlorine grades | Flame retardant | Commercial |
End-Use Applications
What’s the real story? CPE finds use in cable jacketing, roofing membranes and automotive seals. Case study: Electric vehicle manufacturers adopted high-clarity CPE for battery pack seals reducing assembly time by 15%.
| Application | Segment | Growth |
|---|---|---|
| Cable | Telecom | 6% CAGR |
| Roofing | Construction | 5.2% CAGR |
Sustainability Considerations
Recycling CPE blends remains challenging. Here’s the deal closed-loop recycling trials in EU show 40% post-industrial waste reuse.
| Metric | Value |
|---|---|
| Recycle rate | 40% |
| Target 2030 | 60% |
COVID-19 Impact
The pandemic disrupted logistics and slowed construction, but post-2021 rebound in housing fueled demand.
| Year | Volume (kt) | Change |
|---|---|---|
| 2020 | 430 | -4.4% |
| 2021 | 445 | +3.5% |
Market Forecast
Forecast predicts 4.8% CAGR to 2030. This is where it gets interesting… Asia-Pacific remains fastest growing.
| Segment | 2024 (kt) | 2030 (kt) | CAGR |
|---|---|---|---|
| Global | 450 | 600 | 4.8% |
Investment Opportunities
Capacity expansions in India and MEA offer 150 kt new supply by 2027. Joint venture success story: Company A and local partner built 50 kt plant in South Korea reducing lead times by 20%.
| Region | New Capacity (kt) |
|---|---|
| India | 80 |
| MEA | 70 |
Risks and Challenges
Feedstock volatility and environmental restrictions pose threats. But here’s the kicker… alternative polymers like EVA compete in footwear applications.
| Risk | Severity |
|---|---|
| Price volatility | High |
| Regulatory shift | Medium |
Strategic Recommendations
Producers invest in high-performance grades and local warehousing. Buyers secure multi-year contracts and diversify supply base. Ready for the good part? early engagement on regulatory compliance yields cost savings.
Conclusion
In summary, chlorinated polyethylene market offers steady growth thanks to diverse applications and innovation. Buyers and producers should monitor raw material costs and regulatory changes closely for strategic advantage.
FAQ
Q1: What is the chlorinated polyethylene market?
It covers global production trade and end-use of CPE resin.
Q2: How does this market segment operate?
Producers chlorinate HDPE feedstock supply resin through distributors and direct sales.
Q3: What factors drive market growth?
Demand from cable automotive and construction sectors requiring flame retardant impact modifiers.
Q4: Which regions show highest demand?
Asia-Pacific leads with over 55% share followed by North America and Europe.
Q5: What challenges does the market face?
Volatile feedstock prices strict regulations and competition from alternative polymers.